Microsoft Azure Sentinel Honeypot Project
Steps to create a honeypot using Azure Sentinel, Log Analytics, Windows Event Viewer and Third Party APIs to display geographical information of attackers and their attack method.
10/20/20233 min read

In this lab, I will be demonstrating the steps to successfully build a honeypot using Microsoft Azure Sentinel SIEM (Security Information and Event Management) tools. Remember, SIEM tools record important information regarding the security posture of our system in logs. These logs are then monitored by security professionals to look for abnormalities and promptly resolve them. A honeypot refers to luring attackers to attack our virtualized assets to effectively gain more information such as geographical information. To begin this lab we'll start by creating a Microsoft Azure account and create a new virtual machine. Next, we'll create a new resource group which I have named "honeypot-vm" but you can name it anything you wish and choose which time zone you belong to. All of the other default settings should be fine for this lab so continue on to create an administrator account which will be used to access the virtual machine. One important setting that we have to configure ourselves has to do with network rules for inbound and outbound traffic. Essentially, we have to modify the existing rules to allow any and all inbound traffic, so create a new network security group to allow any inbound traffic. Next, we'll create a log analytics workspace which will prompt you to add our resource group, create a name for the workspace and select your time zone.
The next steps involve adding the proper cloud security posture and server protection for our virtual machine, so make sure to enable both in Microsoft Defender. Our log analytics workspace also needs to be connected to our virtual machine so let's connect them. Next, we will configure Microsoft Sentinel which is effectively our SIEM tool which we analyzing the data we collect during this lab. Just search "Microsoft Sentinel" click "Create" and add our Log Analytics workspace that we just created. To freely allow attackers to attempt to breach our virtual machine we must disable our firewall. To do this we must log in to our virtual machine via RDP using our VM's IP address and search for our Windows Defender Firewall and turn it off for both public and private profile. We'll then launch Powershell ISE and set up Microsoft Edge and paste this Powershell Script by Josh Madakor and save it to our desktop. Remember, we're doing this in our virtual machine not on our host machine. Next, we'll create an account for our third party API which will map the geographical information of our attackers. We can make an account here GeoIP which provides a conveniently free service for 1000 API calls a day. After creating an account we will obtain an API key to paste into our into our Powershell script where it states $API_KEY = "<API key>" and run the script.
To proceed with the lab, the next steps involve creating a custom log to import additional data from the IP Geolocation service into Azure Sentinel. First, search for "Run" in the VM and type "C:ProgramData" to access the designated folder. Then, open the file named "failed_rdp" and press CTRL + A to select all the contents. Copy the selection by pressing CTRL + C. Now, open Notepad on the Host PC and paste the copied contents into it. Save the file on the desktop as "failed_rdp.log". Moving to Azure, navigate to Log Analytics Workspaces, and then select the appropriate workspace (honeypot-log). In the Custom logs section, click on "Add custom log". Choose the sample log saved on the desktop (failed_rdp.log) and click "Next". Review the sample logs in the Record delimiter section and proceed by clicking "Next". Under Collection paths, select Type as "Windows" and Path as ""C:ProgramDatafailed_rdp.log". In the Details section, provide a name and description for the custom log (FAILED_RDP_WITH_GEO) and click "Next". Finally, click "Create" to complete the process. We're going to query the custom log we just created to see the available data. This next step may take awhile, so don't be hesitant to take a break and grab a much needed coffee break we're almost at the finish line! After the query has loaded, we'll extract the data from FAILED_RDP_WITH_GEO_CL and and begin to map the data with Microsoft Sentinel to properly categorize it.
Next, we'll create a workbook in Sentinel, remove default widgets and add this query
"FAILED_RDP_WITH_GEO_CL | summarize event_count=count() by sourcehost_CF, latitude_CF, longitude_CF, country_CF, label_CF, destinationhost_CF | where destinationhost_CF != "samplehost" | where sourcehost_CF != "
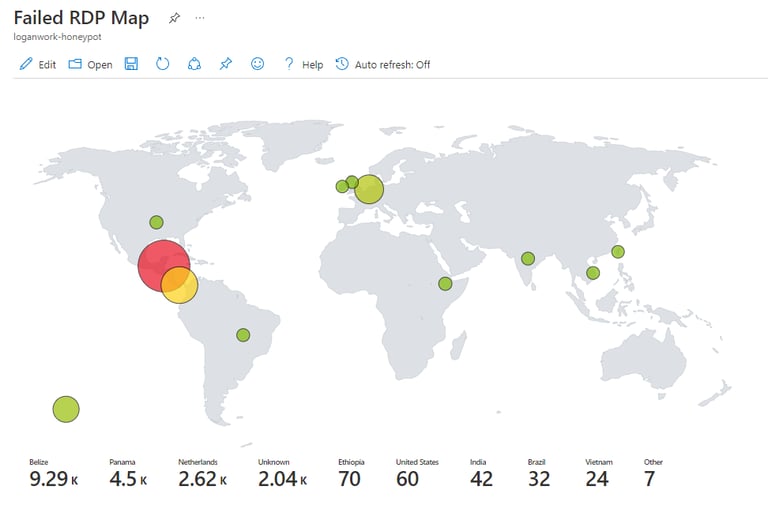
Once this query finishes we will then map these variables. These variables will be mapped according to longitude and latitude, size increasing based on how many attacks occurred in a particular country. Heatmaps which show smaller number of attacks appearing green but countries with more attacks appearing red and larger. Next, will be the metrics which will show how many attacks occurred and where.
When you're done, the map should like this.